
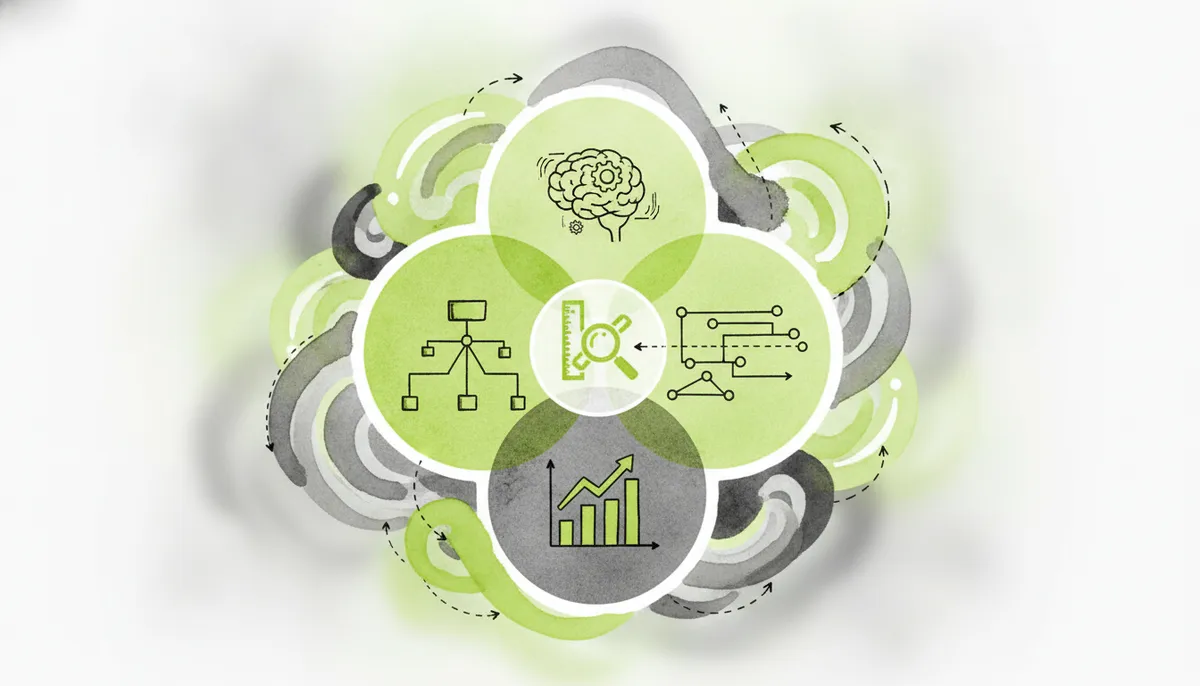
TL;DR: To answer the question—how do I track and measure the performance of automated AI workflows?—you must evaluate three synchronized layers: operational telemetry (API latency, token throughput, error rates), output quality (semantic drift, hallucination rates, BLEU/ROUGE scores), and business ROI (cost per run versus manual labor hours saved). Establishing open telemetry standards like Anthropic’s Model Context Protocol (MCP) and integrating continuous LLM observability tools ensures your AI pipelines remain scalable, compliant, and cost-effective in 2026.
- Key Takeaways
- Introduction
- 1. The Core Metrics: How Do I Track and Measure the Performance of Automated AI Workflows?
- 2. 9 Best Practices to Monitor and Optimize Your AI Automation in 2026
- 3. Essential Tools and Platforms for AI Workflow Monitoring
- 4. Overcoming Common Challenges in AI Performance Tracking
- 5. Framework Comparison: How to Track and Measure the Performance of Automated AI Workflows Across Business Functions
- Frequently Asked Questions
- How do I track and measure the performance of automated AI workflows?
- What is the Model Context Protocol (MCP) and how does it help in workflow tracking?
- How can I monitor NLP performance and detect model hallucinations in AI automation?
- What are the best AI automation platforms for enterprises to measure performance?
- How does an AI marketing consultant help B2B SaaS startups with performance tracking?
- Sources
Key Takeaways
- Establish a Tri-Factor Telemetry Baseline: Monitor operational uptime, semantic generation quality, and unit economics simultaneously to avoid blind spots.
- Standardize Connections with MCP: Leverage Anthropic’s Model Context Protocol (MCP) as an open standard to establish unified, observable communication between AI agents, local systems, and external APIs.
- Track Semantic Drift and NLP Fidelity: Move beyond simple uptime metrics by running automated evaluations (such as cosine similarity and human handoff rates) to catch degraded model outputs.
- Implement Human-in-the-Loop (HITL) Guardrails: Protect production data by setting confidence thresholds that trigger human reviews when AI confidence drops below defined baselines.
- Link AI Workflows Directly to Unit Economics: Quantify token and hosting costs per execution to benchmark savings against traditional engineering or manual operational expenses.
Introduction
Scaling an automated business in 2026 requires more than just connecting foundation models to internal databases; it demands continuous visibility into every agentic step, API handshake, and token generation. Founders and engineering leads deploying autonomous systems constantly ask: how do I track and measure the performance of automated AI workflows without slowing down rapid deployment?
When automated workflows run quietly in the background—handling customer outreach, dynamic data transformations, or continuous code synthesis—silent failures like semantic degradation, hallucinations, and unmonitored API loops can quietly drain your margins and damage client trust. Evaluating these pipelines requires a balanced engineering and growth framework that audits operational stability alongside business impact.
AI Workflow Health = Operational Telemetry + NLP Quality Metrics + Net Financial ROIWhether you are scaling internal data operations or deploying AI agents to save time, understanding these core dimensions allows you to systematically optimize model performance and preserve system reliability.
1. The Core Metrics: How Do I Track and Measure the Performance of Automated AI Workflows?
Evaluating automated AI pipelines requires a multi-layered telemetry framework. Relying solely on basic software metrics like server uptime will leave your workflows vulnerable to output degradation and financial overhead.
┌─────────────────────────────────────────────────────────────┐
│               TRI-FACTOR AI MONITORING STACK                │
├──────────────────────────────┬──────────────────────────────┤
│ 1. Operational Telemetry     │ Latency, TPS, Error Rates    │
│ 2. NLP & Semantic Quality    │ Drift, Hallucination, BLEU   │
│ 3. Financial Unit Economics  │ Cost/Run vs. Labor Offset    │
└──────────────────────────────┴──────────────────────────────┘
Operational Efficiency and Latency Metrics
Operational telemetry forms the foundation of any reliable AI architecture. You must continuously monitor execution time and end-to-end latency across every agentic branch to pinpoint downstream bottlenecks.
- End-to-End Latency: Measure the total wall-clock duration from initial trigger to the final validated state. Spikes often point to slow third-party API dependencies or overloaded context windows.
- Token Processing Speed: Track Time to First Token (TTFT) and Tokens Per Second (TPS). This reveals whether latency originates from network serialization or underlying model inference bottlenecks.
- Error and Rate-Limit Tracking: Monitor HTTP status codes (such as
429 Too Many Requestsand504 Gateway Timeout) across your provider endpoints. High error rates signal the need for better request queuing or multi-provider fallback routing.
Operational Telemetry: The continuous collection, aggregation, and analysis of real-time performance indicators—including network latency, inference throughput, memory consumption, and error rates—across distributed computational pipelines.
Accuracy, Semantic Drift, and NLP Quality
Unlike traditional deterministic software, generative pipelines produce variable outputs that require continuous qualitative evaluation. Tracking the efficacy of natural language processing within your automated pipelines protects your system from compounding hallucinations.
- Semantic Drift Monitoring: Compare production prompt-response embeddings against a golden baseline dataset using cosine distance. Significant deviation indicates model drift or changes in incoming user payloads.
- Syntactic and Semantic Scoring: Use industry-standard benchmarks such as BLEU, ROUGE, or BERTScore for structured extraction and summarization tasks.
- Confidence Scoring and Thresholding: Configure your model to output log probabilities or normalized confidence scores alongside its responses. Route any execution falling below your predefined threshold (e.g., 0.85) directly to human reviewers.
Cosine Similarity (A, B) = (A · B) / (||A|| ||B||)Financial ROI and Resource Allocation
An autonomous pipeline is only as viable as its underlying unit economics. Tracking financial efficiency guarantees that your automated systems create real business value rather than unexpected infrastructure expenses.
- Cost Per Workflow Run: Calculate the comprehensive cost of every execution:
$$\text{Cost per Run} = \text{Input Token Cost} + \text{Output Token Cost} + \text{Compute Infrastructure Overhead}$$
- Labor Offset Ratio: Measure the engineering or administrative hours saved per execution cycle against the operational cost of the system.
- Verified Industry Benchmark: According to research on enterprise automation by McKinsey, generative AI deployments can automate workflows that currently consume 60 to 70 percent of employee time. Mapping this productivity gain directly to reduced operational overhead provides a clear picture of total return on investment.
To scale these optimizations across your organization, implementing custom AI for business growth helps align technical metrics with clear commercial outcomes.
2. 9 Best Practices to Monitor and Optimize Your AI Automation in 2026
Building an enterprise-ready monitoring stack requires disciplined engineering standards and active oversight. Below are nine actionable best practices to maintain optimal pipeline reliability.
9 Best Practices for Workflow Observability
 ├── 1. Standardize on Model Context Protocol (MCP)
 ├── 2. Centralize Structured Execution Logs
 ├── 3. Track Context Window Utilization
 ├── 4. Configure Automated HITL Fallbacks
 ├── 5. Quantify Human Intervention Rates
 ├── 6. Build Bidirectional Prompt Optimization Loops
 ├── 7. Unify Technical & Growth Dashboards
 ├── 8. Monitor End-to-End Outreach Deliverability
 └── 9. Correlate System Latency with Conversion KPIs
Implement Real-Time Telemetry and Logging via Open Standards
- Standardize on Model Context Protocol (MCP): Utilize Anthropic’s open-standard Model Context Protocol to maintain consistent, observable communication paths between your LLMs, internal tools, and external data repositories. MCP normalizes tool telemetry across disparate execution nodes.
- Centralize Structured Execution Logs: Maintain detailed logs containing raw prompt inputs, system configurations, retrieval parameters, and unparsed model completions within a searchable platform like OpenTelemetry or Datadog.
- Track Context Window Utilization: Continuously evaluate token usage against the maximum context limits of your models. Overfilled context windows degrade reasoning capabilities and introduce unnecessary processing delays.
Model Context Protocol (MCP): An open standard developed by Anthropic that enables developers to build secure, two-way connections between AI systems, local developer environments, and external enterprise tools.
Establish Human-in-the-Loop (HITL) Quality Gates
Automated Task Trigger
       │
       ▼
Model Execution & Confidence Scoring
       │
       ├─► [Confidence ≥ 0.85] ──► Auto-Execute & Log
       │
└─► [Confidence < 0.85] ──► Route to HITL Queue ──► Human Review & Prompt Refinement- Configure Automated Fallback Triggers: Set explicit business rules that pause autonomous task completion whenever an agent encounters ambiguous instructions, sensitive client actions, or low-probability answers.
- Quantify Human Intervention Rates: Measure the exact ratio of fully autonomous executions against human-assisted overrides over time. A rising handoff rate serves as an early warning sign that upstream data formats or API models have changed.
- Build Bidirectional Feedback Loops: Capture the specific corrections made by human operators during handoffs. Feed these validated edge cases back into your fine-tuning pipelines and system prompts to systematically eliminate edge-case errors.
Design Custom Dashboards for Small Business AI Marketing
- Unify Technical and Growth Dashboards: Connect your low-level model metrics (latency, token costs, validation failures) directly with front-facing marketing KPIs (conversion rates, lead scoring precision, customer acquisition costs).
- Monitor End-to-End Deliverability: For automated outreach workflows, monitor domain deliverability, bounce rates, and spam-flag triggers alongside text generation quality to protect your domain reputation.
- Correlate Latency with Funnel Drop-off: Track how real-time inference latency impacts end-user conversion across dynamic lead generation forms and customer-facing support agents.
Need an objective audit of your AI pipelines? If you are seeing unmonitored model drift or rising API costs in your current workflows, book an audit to have our team profile your full execution stack.
3. Essential Tools and Platforms for AI Workflow Monitoring
Selecting the right observability stack is crucial for isolating performance bottlenecks before they reach your end users.
┌─────────────────────────────────────────────────────────────┐
│              MODERN AI OBSERVABILITY TOOLING                │
├──────────────────────┬──────────────────────────────────────┤
│ Tracing & Evals      │ LangSmith, Arize Phoenix, TruLens    │
│ Infrastructure       │ Datadog, Prometheus, Grafana         │
│ Enterprise Ops       │ Make Enterprise, Temporal.io, n8n    │
└──────────────────────┴──────────────────────────────────────┘
Leveraging Best AI Automation Platforms for Enterprises
Enterprise-grade orchestration systems such as Temporal, Make Enterprise, and advanced event buses come equipped with native tracing and state persistence. These platforms make it easy to isolate failing steps across multi-stage processes.
- State Persistence Auditing: Ensure your workflow platform records intermediate agent states. When a downstream API times out, you can resume execution without re-running expensive upstream reasoning steps.
- Unified Credential and Permission Logging: Monitor authentication exchanges and role-based access controls (RBAC) across external tools to maintain strict data governance and compliance.
- Cross-Platform Telemetry Sync: Consolidate external alerts into unified incident management platforms like PagerDuty to rapidly respond to systemic pipeline outages.
Dedicated LLM Observability and Evaluation Tools
Specialized LLM tracing platforms provide deep visibility into complex agentic loops and retrieval-augmented generation (RAG) pipelines.
- LangSmith & Arize Phoenix: Trace step-by-step reasoning chains, inspect intermediate variables, and detect prompt injection vulnerabilities or ungrounded model outputs in real time.
- TruLens & Ragas: Systematically evaluate the core dimensions of your RAG pipelines—measuring context relevance, groundedness, and answer correctness on live production data.
- Cost Allocation by Feature: Tag and partition token usage by department, feature, or client to maintain visibility into product-level profitability.
Partnering with an AI Marketing Consultant for B2B SaaS
Translating raw technical metrics into business expansion often requires specialized strategic expertise. Working with an AI marketing consultancy helps bridge the gap between engineering telemetry and pipeline revenue.
- Aligning LLMOps with Growth Goals: Define clean measurement frameworks that directly link model accuracy and response times to customer retention and lower acquisition costs.
- Tailored Infrastructure Roadmaps: Build modern, decoupled architectures that make it simple to swap in newer, more cost-effective models as the ecosystem evolves.
If you are exploring new ways to expand your automated capabilities, our team at Techno Believe provides complete architectural design and integration support.
4. Overcoming Common Challenges in AI Performance Tracking
Managing non-deterministic systems within enterprise IT environments introduces distinct integration challenges that traditional monitoring setups are not built to handle.
Traditional IT (Deterministic)    AI Workflows (Probabilistic)
 ├── Strict Unit Tests             ├── Semantic & Evals Testing
 ├── Static JSON Schemas           ├── Dynamic Natural Language
 └── Predictable Latency           └── Variable Reasoning Depth
Tips for Adapting to AI and Automation in IT Infrastructures
Legacy IT infrastructures frequently struggle with the variable response times and data-streaming profiles common to generative workflows.
- Middleware Modernization: Implement asynchronous message brokers (such as Apache Kafka or RabbitMQ) to decouple your front-facing user applications from slower, multi-step LLM operations.
- Aligning SecOps and LLMOps: Establish strict data masking and automated PII scrubbing protocols to ensure that deep prompt and response logging remains fully compliant with SOC2, HIPAA, and GDPR frameworks.
- Verified Industry Forecast: Industry projections from Gartner state that by 2026, more than 80% of enterprises will have used generative AI APIs and deployed GenAI-enabled applications in production environments. Modernizing legacy IT infrastructure now is essential to support this scale.
Handling Non-Deterministic Outputs in Automated Workflows
Because generative models can return slightly different completions for identical inputs, your testing and validation infrastructure must account for natural response variance.
- Enforcing Structured Outputs: Constrain model completions to strict JSON schemas using features like OpenAI Structured Outputs or instructor-based validation libraries. This prevents malformed data from breaking downstream parsing scripts.
- Automated Prompt Regression Testing: Maintain a version-controlled test suite of prompts. Run automated regression checks on this suite before deploying updated system instructions or transitioning to newer model versions.
- Implementing Semantic Caching: Store previous prompt-response pairs using vector databases such as Redis or Qdrant. Serving cached responses for common requests cuts infrastructure costs and reduces response latency to sub-millisecond levels.
5. Framework Comparison: How to Track and Measure the Performance of Automated AI Workflows Across Business Functions
Balancing engineering stability with bottom-line profitability requires a clear operational framework. Focusing exclusively on execution speed risks deploying inaccurate workflows, while focusing entirely on output quality can quickly blow through your infrastructure budget.
        ┌──────────────────────────────────────────────┐
        │       OPTIMAL MONITORING EQUILIBRIUM         │
        ├──────────────────────────────────────────────┤
        │  Operational Speed  ◄──►  Semantic Quality   │
        │          ▲                      ▲            │
        │          └───────┬──────────────┘            │
        │                  ▼                           │
        │       Financial Viability (ROI)              │
        └──────────────────────────────────────────────┘
Selecting the Right Framework for Your B2B SaaS
When structuring your monitoring framework, match your primary metrics to the core responsibilities of your teams:
- Engineering (LLMOps): Focus on error rates, latency distribution (p95/p99), and semantic similarity regressions to preserve system reliability.
- Product & Compliance: Track hallucination rates, human handoff volumes, and user satisfaction ratings to maintain high output quality.
- Finance & Executive Leadership: Monitor cost per workflow execution and net labor savings to evaluate the ROI of tailored AI solutions across your organization.
Comparison Table: AI Workflow Monitoring Frameworks
The matrix below illustrates how to distribute your observability resources across each critical business function:
| Metric Category | Key KPIs to Measure | Primary Monitoring Tools | Why It Matters for B2B SaaS |
|---|---|---|---|
| Operational Metrics | API Latency (p50/p95/p99), Token Usage, Error Rates (4xx/5xx), Throughput (TPS) | Datadog, Prometheus, Grafana, AWS CloudWatch | Prevents system downtime, flags API bottlenecks early, and ensures predictable application performance. |
| Quality & Accuracy | Hallucination Frequency, Semantic Similarity, Human Handoff Rate, BLEU/ROUGE Scores | LangSmith, Arize Phoenix, TruLens, Ragas | Protects brand reputation, prevents compounding reasoning errors, and maintains strict customer compliance. |
| Business & Financial | Cost per Workflow Run, CAC Reduction, Total Time Saved, Net Labor Cost Offset | HubSpot, Tableau, Looker, Custom Billing Telemetry | Validates the return on technical investments and ensures agentic workflows remain profitable as volume grows. |
Reviewing this matrix helps you identify gaps in your current telemetry stack and build a balanced monitoring architecture.
Need hands-on help implementing these monitoring frameworks? We build and optimize production AI architectures for growing tech companies. Explore our services to see how we help engineering teams maintain fast, accurate pipelines.
Frequently Asked Questions
How do I track and measure the performance of automated AI workflows?
To track and measure your automated workflows effectively, implement a three-tiered monitoring framework focused on operational metrics, semantic output quality, and financial unit economics. Track technical indicators like latency and error rates alongside semantic drift evaluations, and compare total token and infrastructure costs against manual labor hours saved.
What is the Model Context Protocol (MCP) and how does it help in workflow tracking?
The Model Context Protocol (MCP) is an open standard developed by Anthropic that provides a unified, secure connection layer between AI models, internal development environments, and external tools. It simplifies workflow tracking by standardizing telemetry data, tool-call logs, and context window utilization across distributed agentic systems.
How can I monitor NLP performance and detect model hallucinations in AI automation?
You can monitor natural language quality by embedding automated evaluation platforms like LangSmith, Arize Phoenix, or TruLens directly into your production pipelines. These tools calculate semantic similarity against validated baseline outputs and track human intervention rates, flagging degraded or ungrounded completions for immediate review.
What are the best AI automation platforms for enterprises to measure performance?
Leading enterprise teams use orchestration engines like Temporal, Make Enterprise, and custom cloud-native event buses paired with observability tools such as Datadog and OpenTelemetry. These platforms provide state persistence, distributed request tracing, and integrated security compliance auditing from a single operational view.
How does an AI marketing consultant help B2B SaaS startups with performance tracking?
An AI marketing consultant helps bridge the gap between low-level technical telemetry (such as token consumption and model inference latency) and commercial growth outcomes (like customer acquisition costs and funnel conversions). This strategic alignment ensures automated systems actively drive net-new revenue rather than just accumulating infrastructure overhead.
Sources
- Model Context Protocol (MCP) Specification — Official open-source documentation and architectural standards for MCP integration by Anthropic.
- The Economic Potential of Generative AI — McKinsey & Company — Research report analyzing automation potential, workforce productivity gains, and enterprise impact.
- Gartner Forecasts Worldwide AI Software Market — Enterprise predictions and adoption benchmarks for generative AI deployments in production IT environments.
- LangSmith Documentation — Official framework guides for LLM tracing, prompt regression evaluations, and agentic workflow observability.
- Arize AI Phoenix Observability Platform — Open-source LLM evaluation, RAG troubleshooting, and semantic drift detection platform documentation.
Have a similar challenge? Explore our services.
Related in this topic
- 10 Best Practices for AI and Automation in Ecommerce (2026 Guide)
- Top 7 Challenges of AI Automation in 2026 (And How SaaS Founders Can Win)
- 9 Best AI Tools for SEO Optimization in 2026 (Rank Faster)
- AI Document Automation News: Top Trends and Platforms Transforming B2B Workflows in 2026
- Hiring an AI Integration Agency in 2026: The B2B SaaS Founder’s Guide
- Top 7 AI Support Automation Challenges for SaaS Founders in 2026